
Rounding Out The Numbers: On the road again
Off-day reflections from the Consigliere.


The Mariners kickoff another road trip with a three-game series against the AL West division-leading Rangers tomorrow. With no game to distract us today, let’s run through several items catching my eye. Hopefully, you’ll find them as interesting as I did.
Length matters
The Mariners’ starting rotation is arguably baseball’s best. It’s undoubtedly playing a major role in keeping the team afloat until its average-ish offense finds a higher gear.
A strength of Seattle’s starters is their knack for giving manager Scott Servais length during outings. Entering the off-day, the rotation had completed the sixth inning in 33 of 56 starts - most in the majors.
Most 6+ Inning Starts
SEA – 33
MIN – 31
PIT – 28
CHW – 28
SDP – 28
HOU – 27
TEX – 27
CLE – 27
TOR – 26
CHC - 26
The usual suspects are completing the sixth inning most often for Servais - George Kirby (9 starts), Logan Gilbert (7), Luis Castillo (6), Bryce Miller (5), Marco Gonzales (4), Chris Flexen (1), and Easton McGee (1).
So, how’s going longer translating to wins and losses?
Overall, it’s been good. Seattle has notched 21 victories in its 33 starts lasting six-plus frames. Only the Pirates have more.
Most Wins in 6+ Inning Starts
PIT – 22-6
SEA – 21-12
MIN – 20-11
HOU – 20-7
TEX – 20-7
TBR – 20-1
TOR – 17-9
CLE – 16-11
LAD – 16-7
MIL - 16-7
Still, it’s important to recognize every club listed above, except for the Guardians (.593), has a better winning percentage in six-plus inning starts than the Mariners (.636). This is likely attributable to offensive struggles Seattle and Cleveland have dealt with this season.
Before moving onto the next topic, I want to highlight a pair of clubs with crazy-high winning percentages in six-plus inning starts - the Rays and Mets.
Tampa Bay has an amazing 20-1 record. It certainly doesn’t hurt that the Rays have scored five-or-more runs in 11 of these 20 victories. The team’s lone loss was against the Orioles in early May. That said, it’s unlikely this level of success is sustainable over a full season.
The Mets didn’t show up on our leaderboard. But they’re the only club with an undefeated record (15-0) in games when their starter went 6-or-more innings. The issue confronting New York is getting length more often from their high-priced, aging arms - Justin Verlander and Max Scherzer. Both have missed time due to injury and suspension.
Avoiding violent contact
It may not feel like it after the pummeling the Mariners experienced against the Yankees this week and the Pirates last Friday. But Seattle pitchers have the lowest opponents barrel rate of any MLB staff.
Lowest Barrel/PA Rate
SEA - 4.4%
LAA - 4.7%
PHI - 4.9%
TBR – 5%
CHC - 5.1%
ATL - 5.2%
TEX - 5.2%
SDP - 5.2%
MIA - 5.2%
NYY - 5.2%
MLB Average Barrel Rate = 8.2%
“Barrels” are the most potent batted balls and generally have an exit velocity of at least 98-MPH and a launch angle between 26-30 degrees. More importantly to fans, the league currently has a .717 AVG and 2.402 SLG on “barreled” balls. Furthermore, 87.8% of home runs hit this season have been barrels.
All but two Mariner pitchers allowing 25-plus batted balls this year have a barrel rate under the MLB average (5.6%). This seems good to me.
Barrel/PA% of M’s Pitchers
Matt Brash - 1%
Trevor Gott - 1.8%
Penn Murfee - 1.9%
Paul Sewald - 2.1%
Tayler Saucedo - 2.1%
Gabe Speier - 2.8%
Justin Topa - 3.3%
Chris Flexen - 4.1%
Juan Then - 4.2%
George Kirby - 4.3%
Diego Castillo - 4.9%
Marco Gonzales - 5.1%
Logan Gilbert - 5.5%
Bryce Miller - 5.9%
Luis Castillo - 6.3%
MLB Average Barrel Rate = 5.6%
Time’s up!
The Mariners have done a great job at adapting to the new pitch-clock rules. So much so, the team’s pitchers and hitters have combined for seven pitch-clock violations - fewest of any club.
Fewest Pitch Clock Violations
SEA – 7
DET – 9
LAD – 12
KCR – 13
ATL – 13
COL – 15
BAL – 15
WSN – 16
CIN – 17
OAK – 17
TEX - 17
MLB Average Pitch-Clock Violations = 18
Is Servais’ group excelling with the new wrinkle MLB has introduced to games a product of good coaching or disciplined players?
I suspect it’s a combination of both, although I can’t say so for sure. Perhaps it’s just the randomness of baseball and the Mariners regress towards the league-average mark as the season evolves. Still, having just five players dinged for pitch-clock violations two months into the season doesn’t feel like good luck to this nerd.
M’s Violators
AJ Pollock - 2 violations
Julio Rodríguez - 2
Paul Sewald - 1
Penn Murfee - 1
José Rodríguez - 1
He’s still got it!
AJ Pollock may have a pair of pitch-clock violations. But the man can outrun a lot of twenty-somethings. The 17th overall draft pick in 2009 is one of just four 35-or-older players with an above-average sprint speed. In fact, Pollock is the fastest of the aging speedsters.
35+ Players with Above-Average Speed
AJ Pollock (35) - 28.9 ft/sec
Andrew McCutchen (36) - 28.3 ft/sec
Charlie Blackmon (36) - 27.6 ft/sec
Tommy Pham (35) - 27.5 ft/sec
MLB Average Sprint Speed = 27 ft/sec
Pollock isn’t the fastest Mariner. A player 13 years his junior currently holds this distinction - Julio Rodríguez. Still, the Notre Dame product is out-motoring most of his teammates.
Fastest Mariners
Julio Rodríguez - 29.6 ft/sec
José Caballero - 29.1 ft/sec
Sam Haggerty - 29.1 ft/sec
AJ Pollock - 28.9 ft/sec
Teoscar Hernández - 28.4 ft/sec
Jarred Kelenic - 27.6 ft/sec
Taylor Trammell - 27.1 ft/sec
Cal Raleigh - 27.1 ft/sec
Kolten Wong - 26.7 ft/sec
J.P. Crawford - 26.6 ft/sec
Eugenio Suárez - 25.9 ft/sec
Tom Murphy - 25.8 ft/sec
Ty France - 24.8 ft/sec
Is it cold outside?
For a few weeks, debates have been raging over the impact of early-season chilly weather on the Mariners’ overall performance. Some fans view folks broaching this topic as homers simply trying to make excuses for the club’s lackluster offensive production. Perhaps this is true in some instances. Then again, numbers don’t lie.
Data, also referred to facts in some circles, tells us hitters are more productive when the temperatures begin to rise. This is something we all intrinsically know even though some of us may not want to admit it.
The following categorizes the AVG/SLG/BABIP and home run percentage of MLB hitters based on the game-time temperature of outdoor contests since 2002.
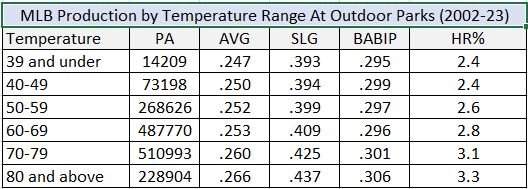
As you can see, the bats begin to noticeably “heat up” once the thermometer cracks the 70-degree mark. Sorry about the pun. Not sorry enough to remove it though.
To be clear, I’m not suggesting lousy weather is the primary cause of the Mariners’ offensive woes this season. But colder temps undoubtedly influenced the lineup’s productivity. How much is conversation for another day.
Trouble with the curve ball, the slider, the sweeper, the…
There is probably no one thing weighing down the ability of the Mariners to consistently score runs. That said, the lineup has been negatively affected in a big way by a form of kryptonite we should discuss - breaking balls.
The Mariners are hitting .181 against breaking balls, which is the worst AVG in the majors. In fact, they’re the only club with an AVG below .200. Next lowest is Pittsburgh, which is 19 points higher than Seattle.
Fastballs: four-seam, two-seam/sinker, cutter
Breaking: curveball, slider, sweeper
Off-speed: changeup, split-finger
Honestly, the lineup isn’t exactly knocking the cover off the ball against other pitch types. But it’s been a special kind of ugly against breaking balls.

Considering Seattle’s struggles against curveballs, sliders, and sweepers, it shouldn’t come as a surprise the team is seeing the fifth-highest rate (32.7%) of breaking balls in MLB.
I know what you’re thinking. How are individual Mariners performing against each category of pitch?
The following provides the answer. Please note an AVG highlighted in red meets-or-exceeds the league-average in each category. There isn’t as much red as you’d probably like to see, folks.

It’s important to note several hitters listed above are playing sparingly. Therefore, it’s tough to fairly evaluate how they’re performing - at least it is for me. Specifically: Pollock, Sam Haggerty, and Taylor Trammell, who was optioned to Class-AAA Tacoma today.
You can’t argue with results
Prior to the season, I suggested the Mariners’ win-loss record in May was one of 14 key numbers to watch this season. Why? It was their worst month last season.
To Seattle’s credit, it went 17-11 in May. But a closer look at the team’s record probably plants a seed of doubt in the minds of some fans heading into June.
Over half of the Mariners’ wins last month came during confrontations with the hapless 12-win A’s and the Tigers. Seattle was below .500 against the remaining competition.
M’s Record & Run Differential in May
v DET/OAK (9-1), +34
v ATL/BOS/HOU/NYY/PIT/TEX (8-10), -11
Still, the Mariners did record series wins against two teams that had winning records when they met - Houston and Pittsburgh. Furthermore, Seattle finished May on a high note with a 7-3 home stand.
Yes, it’d be nice to see more series wins against clubs with winning records. At some point, Servais’ squad will have to do just that in order to climb in the standings. But consider this. Those hapless A’s have beaten three teams with a winning record twice this year. Two are ahead of Seattle in the standings: the Angels and Rangers. The other is the NL East-leading Braves, which Oakland just beat in a series.
This is why I don’t concern myself with the records of the teams the Mariners are beating - as long as they keep winning.
My Oh My…